Health Care Cost Trends in Maryland: What we’ve learned from three years of claims data
Since we launched Wear The Cost in 2017, we have collected and reported on claims data for the most common hospital procedures in Maryland. But, the reporting process takes a long time. Since there is a lag in when all the claims are filed and reported, we can’t even begin to process the data for about 12 months after the end of the year. Once we are sure all the claims are in, it takes us a long time to make sure that our data provide a clear and accurate picture about what certain procedures, or “episodes of care,” cost.
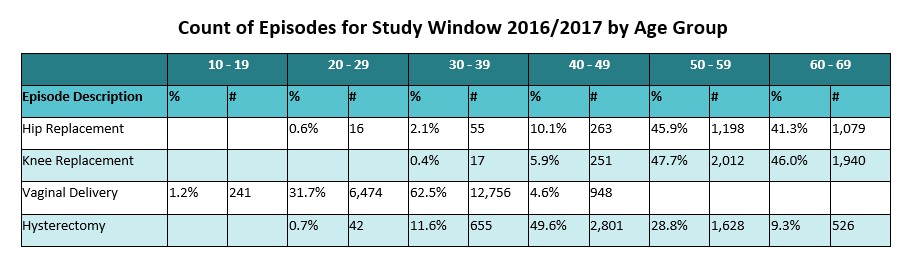
For these reasons, we started with 2014–2015 data on four of the most common procedures: hip replacement, hysterectomy, knee replacement, and vaginal delivery. Since then, we’ve added new data sets for 2015–2016 and 2016–2017. When we released the 2016–2017 data, we also added six new procedures: bariatric surgery, colorectal resection, c-section, gall bladder surgery, lumbar laminectomy, and lumbar spine fusion.
The good news is that with each data release, we’re able to provide you with more accurate and comprehensive information! Over the years, we have seen an increase in the number of episodes of care that we can report. This is not because there has been a huge uptick in the amount of procedures being performed, but rather because we have refined our data vetting process. Our quality checks are resulting in more usable data points, which means that we have more accurate information to share with patients, providers, and you.
The other piece of good news: We now have three years of data for the original four procedures we featured here on Wear The Cost. So, we can start seeing if there are any emerging trends in the health care costs across Maryland. Take hip replacements, for example. The statewide average cost for this procedure declined over the three-year period. After a slight decrease in 2015–2016, costs across the state dipped 7% in 2016–2017. This trend does not play out the same way at the individual hospitals, however. For the nine hospitals for which we have data for all three years, three of them actually reported an increase in costs during this time period.
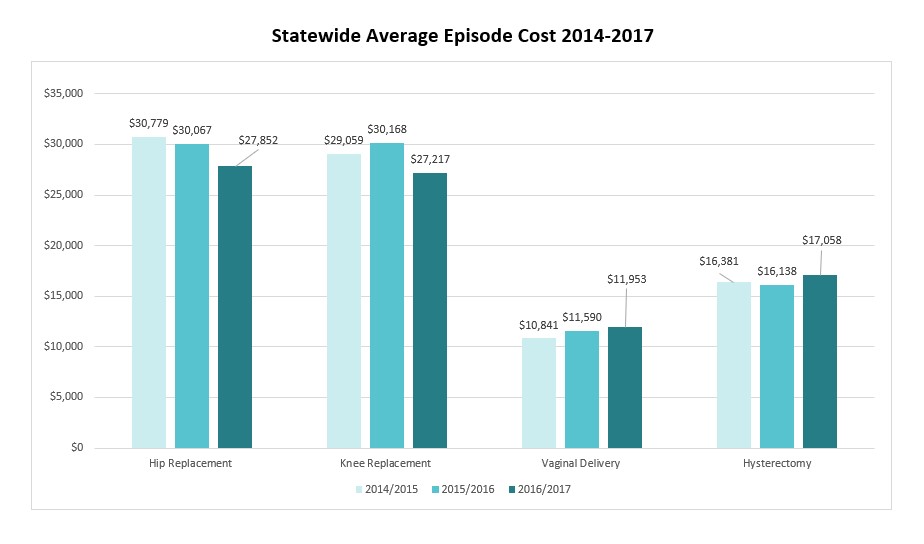
On the other hand, the statewide average cost for vaginal deliveries increased over the three-year period. There was a 7% increase between 2014–2015 and 2015–2016, and then a 3% increase in 2016–2017. In general, this statewide increase is consistent with the data at individual hospitals – while the costs at some hospitals increased more than others year to year, all of them saw increases over the three-year period.
The data for hysterectomies and for knee replacements weren’t as clear cut. The costs of knee replacements went up slightly in 2015–2016 from the previous year, but then declined by nearly 10% in 2016–2017. The cost of hysterectomies went down slightly in 2015–2016 and then up slightly the following year. We’ll continue to keep an eye on these costs and see how they trend in the future.
While we need more information to help pin down the “why” behind all these numbers, this information helps us start the conversation and ask the right questions.
At Wear The Cost, we remain committed to increasing transparency in health care. We’ll keep working to add more recent data and more episodes of care, so that we can help more Marylanders understand the costs of their health care and keep those costs as affordable as possible.